February, 2003Note:
Estimates were calculated for all countries by simply
multiplying USDA PS&D "Area Harvested" estimates by "Average
Estimated Seed Variable Cost of Production" based on data from
Global Insight, Inc. Because planted area and abandonment rates were
not available, the data have a slight downward bias. The variable
cost of production data seeks to capture the cost of purchased seed
as well as the opportunity cost of farm-saved seed (the local market
price of the grain or oilseed in question). Seed cost of production
data in US dollars per planted hectare are available from Global
Insight for countries that together represent 55 percent of world
total area for wheat, 75 percent for corn, 73 percent for rice, 88
percent for soy, 34 percent for barley, 43 percent for sorghum, 70
percent for cotton, 42 percent for sunflower, and 87 percent for
rapeseed/colza. Regional average costs of production from available
countries were applied to countries for which no cost of production
estimates were available. For country/crop combinations with no
regional proxy, the average cost of production for all available
countries was used. Despite the obvious short-comings of this crude
method, it is hoped that the results provide an idea of market size
(including informal markets) and growth trends.

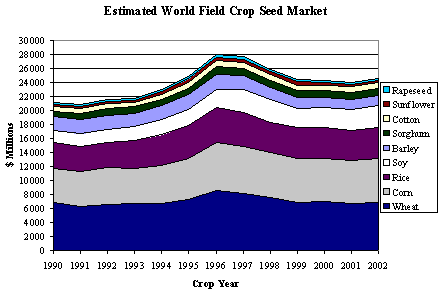
The surge in 1996 –1997 and subsequent decline is explained by
both changes in area and seed costs. In 1996, world total area
planted to wheat grew about 5 percent (mainly due to increased area
in China, Russia and the United States). That same year, world area
planted to corn also grew about 5 percent (mainly in China, the
United States and Mexico) and has remained relatively stable. Soy
area surged in 1997 by almost 10 percent (largely attributable to
Brazil and the United States) and has continued to grow. Meanwhile,
the unweighted average seed cost of production for rice rose from
$47 per hectare in 1992 to $66 per hectare in 1996, then fell to $60
per hectare by 1998. The seed cost per hectare for soybeans rose
from $42 in 1992 to $58 in 1996, then fell to $47 by 1999. The
respective seed costs for corn were $37, $46 and $40. Average seed
costs for other crops remained remarkably stable over the decade,
which suggests that in many cases, depreciating currencies relative
to the dollar were offset by rising seed prices.
The estimated annual value of internationally traded field crop
seeds, of the kinds featured in the chart above, is about $1 billion
– only 4 percent of the total world market. Corn seed accounts for
three-fourths of internationally traded field crop seeds by value
(roughly $780 million in MY 2001/02) and amounts to 12 percent of
world corn seed.

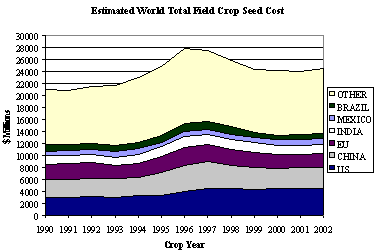
Six markets -- the U.S., China, EU, India, Mexico and Brazil --
account for about half of the total field crop seed market. The
United States accounts for 18 percent. While still relatively small,
the potential markets that have expanded the most since 1990 appear
to be in West Africa (notably Togo, Chad and Mali) and Southeast
Asia (especially Indonesia and Burma). Potential markets for field
crop seeds shrank in much of Southern Africa, Russia and much of
Eastern Europe over the past 12 years.