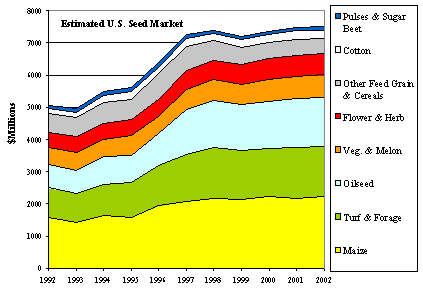
Note: No single source exists, so the following
methodology was used to estimate U.S. seed consumption: For maize,
oilseeds, other feed grain and cereals, cotton and sugar beets,
consumption estimates were calculated on yearly cost of production
data (seed cost per acre) and area harvested. Area planted was not
used because it is not available for other countries and the
ultimate goal is to build a worldwide database. Ignoring abandoned
area could make these crops’ seed markets underestimated by as much
as 10 percent in some years. For horticultural seeds and pulses
(beans and peas), a ratio of total seed market value to the value of
total production was estimated using the Bureau of Economic Analysis
Input-Output 1997 benchmark data (the ratios are 0.05 for sugarbeets
and floraculture, 0.09 for beans, lentils and peas, and 0.08 for
vegetables). The ratios were assumed fixed and applied to the total
value of U.S. production (according to NASS and ERS) for those crops
in the years 1992-2002. Turf and forage seed includes only Kentucky
blue grass, fescue, ryegrass, alfalfa, orchard grass and sudan
grass. Production data is available from the agricultural census of
1992 and 1997. The compound annual growth rate was applied to the
years in between. After subtracting net exports of each kind, the
remainder was multiplied by April prices collected by NASS. Industry
sources have confirmed the magnitudes and trends produced using this
methodology and illustrated above.

The chart above is based on estimated consumption. The United
States is a net exporter of planting seed, with annual exports and
imports of roughly $800 million and $400 million, respectively.
Changes in stocks are hard to estimate, but adding net exports to
the consumption data and assuming small or no changes in stocks puts
domestic planting seed production over $8 billion. U.S. seed
production in 2002 was therefore twice as large as the value of U.S.
cotton production ($3.6 billion according to NASS), larger than
wheat production ($5.9 billion), over half the value of U.S. soybean
production ($14.8 billion) and at least a third as large as U.S.
corn production ($21.2 billion). Seed, when considered as a distinct
segment of American agriculture or as a single "crop," clearly ranks
among the largest.
Maize seed is the largest segment of the domestic planting seed
market, valued at $2.2 billion in 2002. Maize seed has maintained
the same share of the total, about 30 percent, over the past ten
years. Turf and forage seed places second, at almost $1.6 billion,
and oilseed for planting (mostly soybean) a close third at $1.5
billion. These last two segments appear to have enjoyed the most
rapid growth since 1992. Unfortunately, the turf and forage seed
data is the weakest link at present. The domestic vegetable and
melon seed market is believed to be worth about $685 million, up
from $506 million in 1992.
The period 1993-98 was one of spectacular growth for the U.S.
seed market, especially 1996 and 1997. The introduction and
widespread acceptance of biotech soybean seed is a major factor, as
many areas switched from farm-saved seed to purchased seed.
Relatively slow growth in the U.S. seed market since 1998 is due in
large part to intense price competition. Based on the 10-year and
5-year trends in U.S. seed consumption and trade estimates, a
domestic market worth over $9 billion by 2010 appears to be a
reasonable forecast, and domestic seed production of around $10
billion.
U.S. seed exports represent about 10 percent of production. That
proportion has not changed significantly since 1992. Considering
that international trade in planting seed faces more phytosanitary
and technical barriers than most commodities, is subject to rules
governing technology transfer, and has been replaced by local
production in many areas due to growing concerns about genetic
purity – ten percent is no small share: U.S. seed exports represent
about one-fifth of world planting seed trade.
The importance of exports to U.S. seed production despite high
barriers to international trade is due to strong push and pull
factors. Push factors include developments such as industry
concentration, biotechnology, and growing demands from increasingly
fewer, larger and more sophisticated farmers. The time it takes for
a new seed product to go from introduction to obsolescence has been
cut in half during the past decade even as the cost of new product
development has increased. Increased competition has translated into
a need for ever-larger markets over which to spread expenses. The
situation has also increased exports of parent seed which is bred or
multiplied overseas before returning to the domestic market.
Off-season multiplication in the Southern Hemisphere and access to
foreign sources of germplasm are important pull factors that keep
trade high relative to production and use. The high rate of exports,
especially relative to the rest of the world, is testament to the
competitiveness of the U.S. industry in satisfying foreign
countries’ import requirements and meeting foreign demand for
high-quality, well-regulated planting seed.